Examples gallery
Real maps, built with Mappt
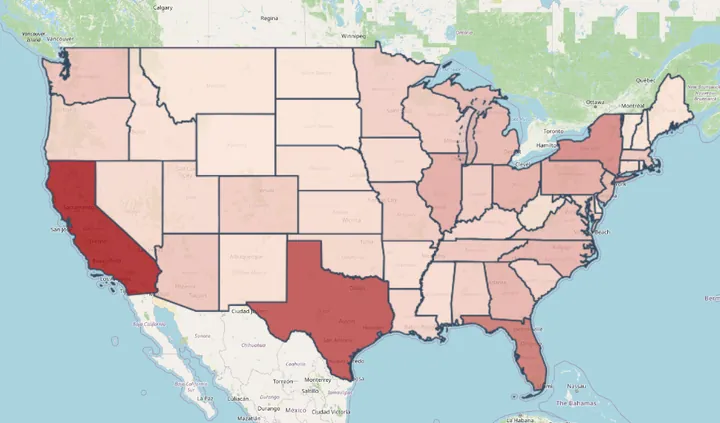
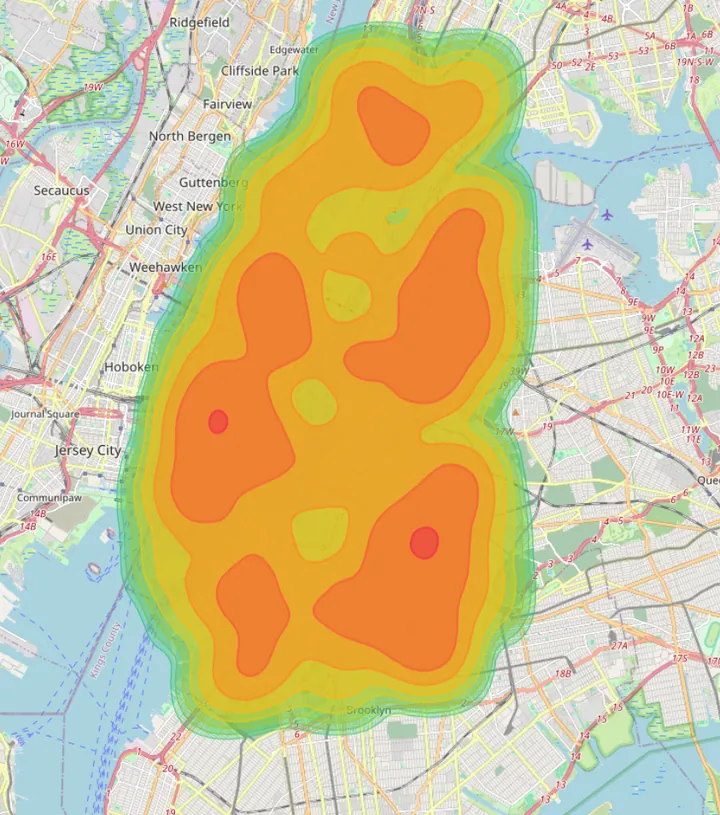
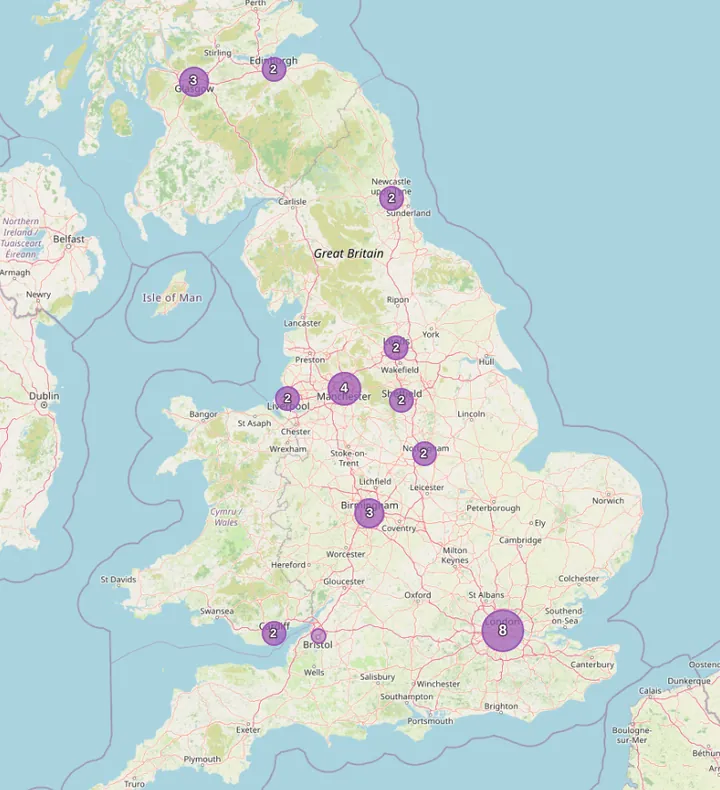
Browse a few of the maps you can create - then make your own. Every example below was built from raw data in minutes.
See what people are mapping with Mappt
From population density to store networks - a few of the maps you can build in minutes.